Theoretical Basis
|
| Electromagnetic Radiation |
|
|
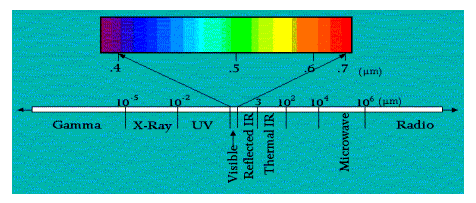
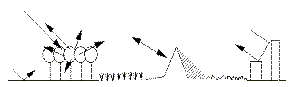
Spectral responses measured by remote sensors over various features at various
wavelengths often permit an assessment of the type and/or condition of the features and
are often referred to, as “spectral signatures”. “Spectral signatures” enable us
to distinguish snow from water, vegetation from soil and so on. Reference: |
|
Region of Sensitivity for an Artificial System of Photointerpretation and Remote Sensing |
Thus giving the possibility to observe the
respective images in the part of the spectrum of the electromagnetic radiation covering
the region from 0.3 to 15.0 μm. Reference: Rokos, D., in "Environmental Crisis", pp=215-259, ELKAM, 1993 |
|
|
|
|
These sensors are sensitive to the wavelengths between 0.3μm and 3.0μm. Reference: Rokos, D., in "Environmental Crisis", pp=215-259, ELKAM, 1993 |
| Artificial System of Remote Sensing on the basis of the registration of the emitted (thermal) Electromagnetic Radiation |
|
|
|
|
| A sensor/system
(multispectral scanner) can be simultaneously sensitive to the electromagnetic radiation
reflected and emitted from the N.E.S. which is registered in distinct characteristic zones
(channels) concerning specific wavelengths (e.g. the Thematic Mapper (TM) of the Landsat
US satellite registers the E.M.R. in three regions of the visible part of the spectrum in,
one of the near infrared, two the middle infrared and one the thermal infrared). Reference: Rokos, D., in "Environmental Crisis", pp=215-259, ELKAM, 1993 |
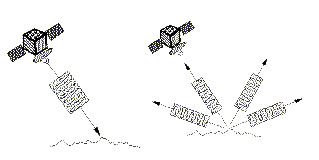
| Active System of acquisition of Remote Sensing data on the basis of the transmittance of artificial E.M.R. and the registration of the radiation backscattered from the earth |
|
|
|
|
Reference: Rokos, D., in "Environmental Crisis", pp=215-259, ELKAM, 1993 |
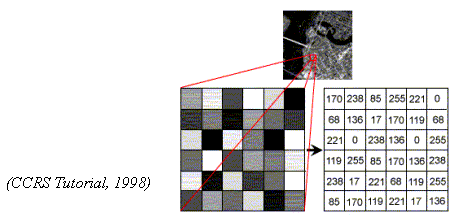
| Digital Images |
|
|
| Digital Image Formats |
Generally, scanning saves an image to a file. Thus, each row of the array or matrix will normally correspond to one scan line. In grayscale scanning, a value ranging from zero (for black) to 255 (for white) is stored for each cell. In colour scanning mode, a value from 0 to 255 is stored for each of the three primary colours (red, green and blue). Digital images can be packaged mainly in the following three generic formats: |
| In BSQ format the
digital values of the bands of the image are stored sequentially. First band, second
band... and so on. In BIL format the digital values of the relative rows of every image band are stored sequentially. First row of first band, first row of second band..., second row of first band, second row of second band... and so on. In BIP format the digital values of the relative pixels of every image band are stored sequentially. First pixel of first band, first pixel of second band... second pixel of first band, second pixel of second band... and so on. (Verbyla et al.in Processing Digital Images in GIS , 1997) |
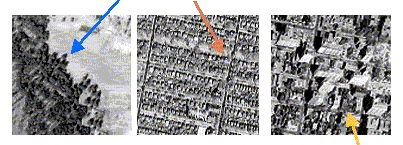
| Photorecognition elements |
 |
|
| The photos are from CCRS, 1998 |
| Individual’s perceptive ability |
Depending on individual perceptive ability, experience and the type of imagery, human beings are adept to varying degrees at visually interpreting images, especially those produced by cameras. When the interpreter can identify what he sees, he can better understand the spatial arrangements of the objects represented and the context of an image. Through photointerpretation, the image data become usable information. But there are certain limitations and constraints to human interpretation. For example, the human eye sees only in the visible part of the electromagnetic spectrum and the human brain assigns characteristic colours -the “true”colours- to the features of the earth’s surface. Satellite imaging devices additionally record parts of the electromagnetic spectrum to which the human eye is not sensitive, resulting, after the necessary processing, in images that reproduce the world in unfamiliar or “false” colours. Specialist knowledge and experience are needed to improve the interpreter’s capacity to understand and analyse satellite remotely sensed images. |
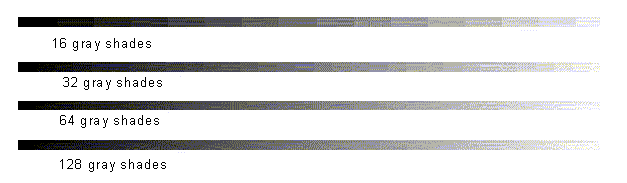
| Human ability in detecting gray shades differences |
|
| Source
: NOAA/NESDIS Forecast Products Development Team 1998 |
| Conventional aerial photographs |
Panchromatic aerial photographs display the record of terrain brightness across the entire visible part of the electromagnetic spectrum as a grayscale image. |
|
Infrared
aerial photographs use film sensitive to the entire 0.3 to 0.9 μm wavelength
range and are useful for detecting differences in vegetation cover, due to their
sensitivity to IR reflectance. colour photography involves the use of three layer film each layer being sensitive to different ranges of light (blue, green and red light). |
| SPOT Panchromatic image, date 21/09/93, resolution 10m, CNES |
In False colour photography (CIR), the three emulsion layers are sensitive to green, red and near-infrared radiation, which are processed to appear as blue, green and red, which is valuable in scientific studies of vegetation. (CCRS, Fundamentals of Remote Sensing, 1998) |
|
colour photo Blue Green Red |
| (Short 1998, Goddard Space Flight Center, NASA) |
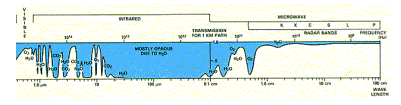
| Thermal infrared spectrum |
Apart from visual and near-infrared, other bands of the spectrum commonly used include thermal infrared (heat) and microwave (radar). |
The major subdivisions of the EM spectrum (Conventional separations) [Ramsey 1998] |
Thermal infrared spectrum - emitted, can only be detected using electro-optical sensors. The radiation is emitted from the Earth’s surface in the form of heat. Because the gases absorb electromagnetic energy in specific regions of the spectrum, the wavelengths that we can use most effectively for remote sensing in the thermal infrared portion of the spectrum are 3,5-5,5μm and 8-14μm, atmospheric windows: |
|
| Source: CCRS, 1998 |
| What about Landsat Imagery? |
Orbital characteristics of Landsat: the satellites’ orbital inclination is nearly polar. Landsat sensor systems have the ability to observe the globe with approximately 26 km of sidelap between successive orbits, with a maximum at 810 north and south latitudes (about 85%) and a minimum at the equator (about 14%), useful for some stereoscopic analysis applications. |
|
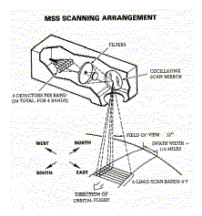
| For a polar
orbiting satellite, scanning is achieved by having the axis of rotation of the mirror
along with the direction of motion of the satellite so that the scan lines are at right
angles to the direction of motion of the satellite. A number of sensors have been on board the Landsat series of satellites, including the Return Beam Vidicon (RBV) camera systems, the MultiSpectral Scanner (MSS) systems, and the Thematic Mapper (TM). |
|
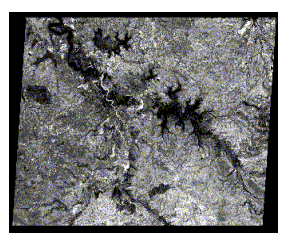
| What is an Imaging Radar ? |
Imaging RADAR (Radio Detection And Ranging) systems are active sensors which provide their own source of electromagnetic energy. Therefore, images can be acquired day or night. Also, microwave energy is able to penetrate through clouds and most rain, making it an all weather sensor. |
|
| Radar images are
composed of many dots, or picture elements, each representing the radar backscatter for
that area on the ground.
|
|
|
In analysing radar images, the higher or brighter the backscatter on
the image, the rougher the surface being imaged. Backscatter is also sensitive to the target’s electrical properties, including water content. |
| Imaging different types of surface with radar [Wong 1996] |
|
 |
National Technical University of Athens |