 |
 |
![]()
![]()
 |
 |
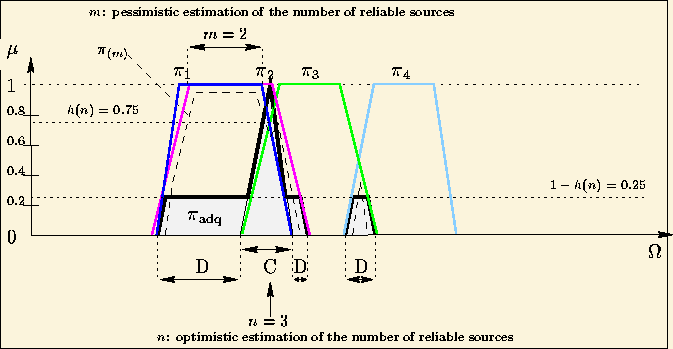
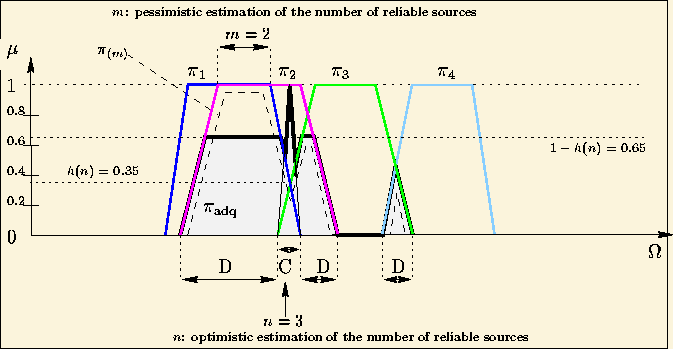
A majority of sources agree at least a little. In figures 34
and 35,
the number of agreeing sources is estimated to be at least m=2 sources
( ![]() )
and at most n=3 sources (
)
and at most n=3 sources ( ![]() on the one hand, and
on the one hand, and ![]() on the other hand).
on the other hand).
Area C corresponds to the values considered to be plausible for parameter x by a majority of sources. This area is favoured by using renormalized conjunctive fusion.
Agreeing areas are still found outside area C, but for a lower number of sources. In order not to perform a purely disjunctive fusion, conjunctive fusion is used again, but for a restricted number of sources. Pessimistic estimation m of the number of reliable sources is carried out. Only areas with intersections of m sources are preserved (areas D); and to limit their weight compared to the majority of agreeing sources, their effects are limited to the degree of conflict between sources n.
Thus, if sources n agree strongly ( ![]() ),
then sources m, limited to (
),
then sources m, limited to ( ![]() ),
are little used (figure 34).
However, if sources n, although more numerous, agree little (
),
are little used (figure 34).
However, if sources n, although more numerous, agree little ( ![]() ),
then they should be counterbalanced by sources that are less numerous but
more reliable (sources m) (figure 35).
),
then they should be counterbalanced by sources that are less numerous but
more reliable (sources m) (figure 35).