 |


|
Fuzzy spectral
unmixing
|
| This method was proposed in 1999 by Petrou and Foschi ("Confidence
in Linear Spectral Unmixing of Single Pixels", IEEE Transactions on
Geoscience and Remote Sensing, Vol. 37, No. 1, January 1999).
Let us consider for simplicity the case when we have two pure classes. Let
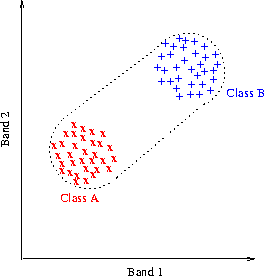
us assume that each class is represented by a few pixels (x and + in figure
7 ) in the 2-band scatter diagram. |

Figure 7
|
Any pixel that is a mixture of these two classes has to be inside the convex
hull of the x's and +'s in the figure, marked by the dotted line. If a pixel
is outside this convex hull, it most likely contains a proportion from a
third, unidentified class. On the other hand, due to the observed variability
of each pure class, there may be many combinations of relative proportions
of the two classes that may give rise to the same mixed pixel inside the
convex hull. Petrou and Foschi proposed the use of the pure class pixels
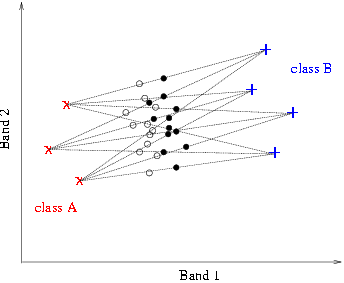
in the creation of model mixtures that fill up the convex hull. Two such
model mixtures are shown in figure 8. For simplicity only 3 pixels are used
to represent class A and only 4 pixels to represent class B. |

Figure 8 |
| They have been created by the combination of all pixels that
represent class A with all pixels that represent class B in proportions 60%-40%
and 50%-50%. The two model mixtures are represented in figure 8 by open and
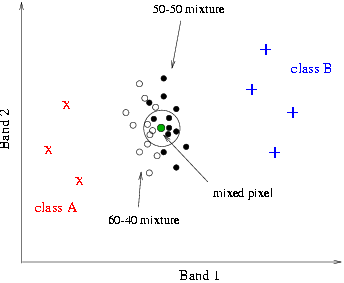
filled circles respectively. When a genuine mixed pixel then is to
be unmixed, its position is identified in the scattergram and a circular
neighbourhood around it is considered. The number of representatives of the
various model mixtures within that neighbourhood is counted and the pixel
is said to belong to each model mixture with confidence corresponding
to the number of representatives each mixture has within the circular
neighbourhood. |

Figure 9 |
This method does not come up with a single answer, but with a set of possible
answers each with an associated confidence level. This ambiguity reflects
the genuine ambiguity that exists due to the intraclass variability of the
data.
|
 |
|

|