 |


|
For each image we calculated the NDVI and the mixing proportion of vegetation
a, by applying the linear mixing model using the mean values and the
second order moments. The NDVI was calculated in two ways: |
|
|
-
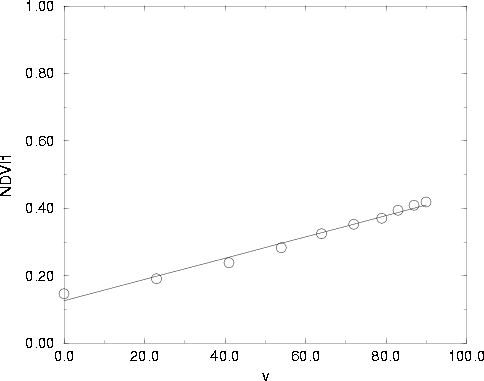
From the average reflectance values of all pixels in the image. Call this
NDVI1.
|
-
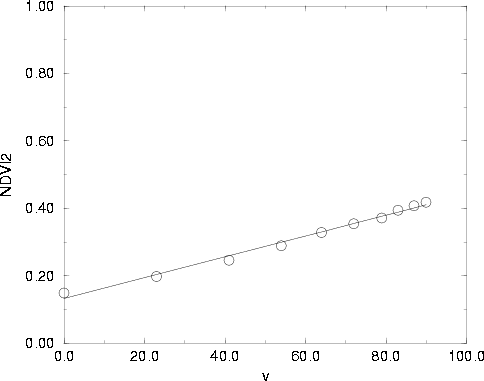
For each pixel separately. All NDVIs were subsequently averaged to yield
an NDVI for the whole image. Call it NDVI2.
|
|
|
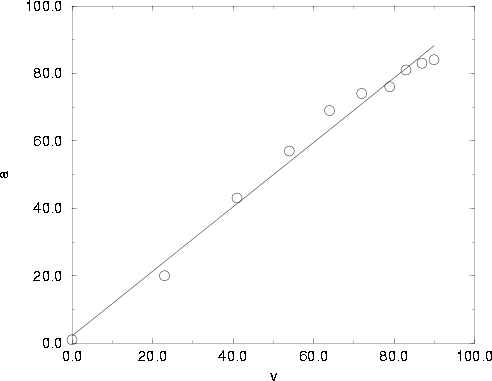
The ideal indicator is one that is linear with the true vegetation cover
on the ground. In the figures that follow we plot for each image the
estimated mixing proportions of vegetation a, NDVI1 and
NDVI2 versus the true fraction of vegetation cover v. |
|
|
pixels 5 x 5 m2
 |
The straight line is at 45o. Ideally all points should be on that
line. |
 |
 |
The straight line drawn is the least squares error fit to the data. For a
good indicator all points should be on the line. The correlation coefficient
of the least squares error fitting is r=0.993 for NDVI1
and r=0.995 for NDVI2. The closer to 1 r is, the better
the fitting.
We see that NDVI2 has higher value of r so it is more linear
with v than NDVI1. |
|
 |
 |
 |