 |
 |
![]()
![]()
We used the additional source ``card of the favourable areas'', highly reliable, to set up group K1. The other images (spectral bands) are sources less reliable than the preceding one. This is why we choose to gather them in group K2.
|
(76) |


| Rates of classification obtained | |||
| Number of pixels correctly classified (A) |
Number of pixels in samples (B) |
Rate of pixels
correctly classified |
|
| 1 | 430 | 459 | 93.68% |
| 2 | 406 | 459 | 88.45% |
| 3 | 295 | 306 | 96.41% |
| 4 | 368 | 391 | 94.12% |
| 5 | 378 | 459 | 82.35% |
| 6 | 430 | 459 | 93.68% |
| 7 | 440 | 459 | 95.86% |
| 8 | 448 | 459 | 97.60% |
| 9 | 443 | 459 | 96.51% |
| TOTAL | 3638 | 3910 | 93.04% |
|---|---|---|---|
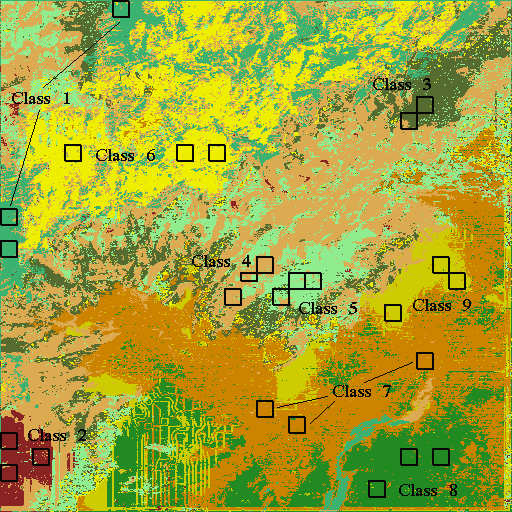
Fusion by priority of the groups K1 and K2 (definite above) leads to a good result with an average of 93.04% of the pixels of the samples correctly classified. Additional information ``card of the favourable zones'', highly reliable, was correctly put forward, compared to the other sources. But the spectral information contained in the spectral bands played a significant role of refinement of information.
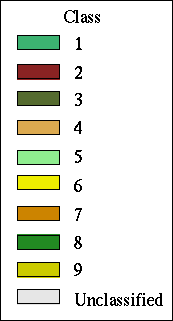
The image obtained (table 38) presents an aspect more disturbed than the image of the theoretical distribution ``ideal'' of each class (table 37). This disturbed image is much closer to the physical reality presented by the information of the image LANDSAT than the ``ideal'' card calculated.
Classes 1 (low forest sempervirente) and 4 (semi-deciduous forest or dry deciduous), over-represented on the ``idea'' card, yielded their place mainly to class 6 (mosaic of shrubby savanna and reforestations).