|
|
![]()
Calculation of Possibility
Distributions from
Histograms of Grey Levels
![]()
To be able to handle spectral information relating to each class, we must
represent the histograms of grey level according to the model of representation
of information chosen i.e. possibility distributions.
Dubois and Prade [Dubois and Prade, 1983] [Dubois and Prade, 1987a] propose to calculate a possibility distribution from a statistical distribution.
 |
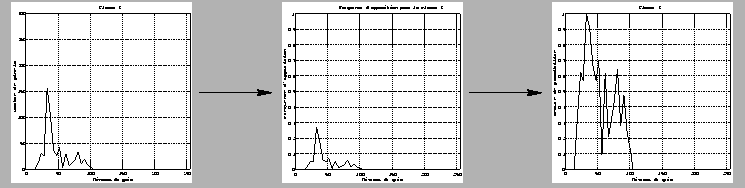
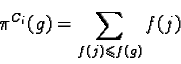
The frequency of appearance f of grey level g for class
Ci is obtained by (figure 10) :
|
|
(1) |
where:
The frequency f of appearance of grey level g for class Ci is proportional to the height of the histogram for the grey level of x.
|
|
(2) |
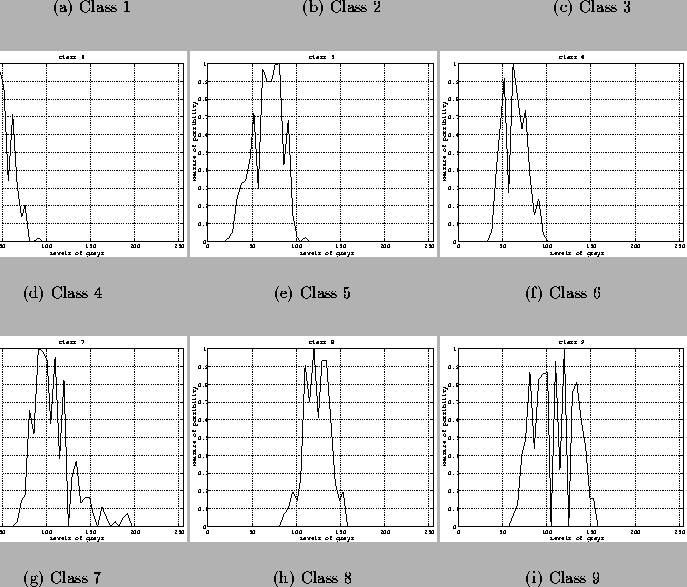
This transformation gives more weight to radiometries most characteristic of each class (peaks of the histograms, figure 11), but especially brings to the same level these most characteristic radiometries (each class has at least the most characteristic radiometry to which a possibility measure of 1 is set). It finally allows to preserve the general aspect of the histogram.
Figure 13 presents the possibility distributions calculated from the histograms in figure 10. These distributions often present a very disturbed aspect because they remained very similar to the original histograms.
A smoothing of those distributions would help in removing the holes present in some distributions. But such a solution has not been used because several classes have already their histograms in a comparable interval of grey levels, therefore strongly merged the ones with the others.
The smooth histograms for these classes should increase their similarities, and thus worsen confusion.
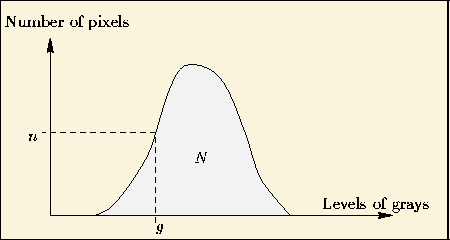
In addition, the histogram for the whole image MSS4 (figure 12) contains holes, due to some grey levels missing. These holes appear also, therefore, in the histograms of the classes.
 |
 |