Photointerpretation and Remote Sensing Methodology
|
3.2 Analogue and digital methods
3.2.1 Digital Image Analysis vs. Visual Interpretation
3.2.2 Advantages and disadvantages of analogue and digital methods3.3 Pre-processing of digital Remotely Sensed Imagery
3.4 Simple Image Enhancement of Remotely Sensed Imagery
3.4.1 Contrast Enhancement
3.4.2 Pseudo-colour Enhancement - Density Slicing
3.4.3 Image enhancement through basic numerical calculations
3.4.4 Edge enhancement
3.4.5 Filtering
3.4.6 Special enhancement transformations
| 3.1 Introduction | |
Photointerpretation and Remote Sensing Methodology can be defined as: the dialectic and interdisciplinary integration of personal experience, reasoning, specific scientific knowledge and expertise and ground truth, in order to investigate, qualitatively and quantitatively, the objects, facts, characteristics, phenomena and patterns of the natural and socio economic reality, as well as of their multidimensional relations, interactions and interdependencies, and their change trends in time, by using their remotely sensed imagery.
|
|
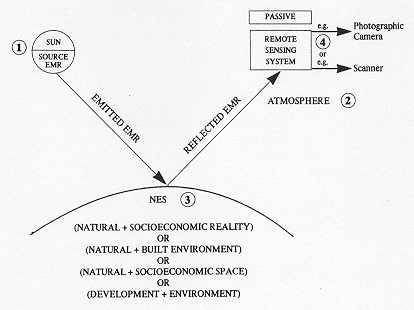
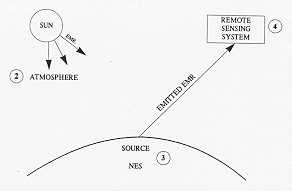
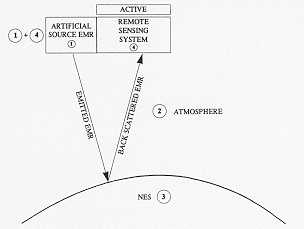
| 3.1.1 Analogue and Digital Sensors and Systems | |
|
|
|
Source: Rokos “The contribution of remote sensing to the observation, monitoring and projection of the environment” in Environmental Crisis, ELKAM, Athens, 1993.
|
| 3.2 Analogue and digital methods | |
When processing and analysing remotely sensed images, manual and digital methods are usually combined. |
|
|
In
manual image processing and analysis, most of the fundamental
photorecognition elements of visual interpretation, as well as their appropriate
combinations, are used. Manual interpretation is often limited to analysing only a single
channel of data or a single image or stereoscopic model at a time. |
Digital image processing and analysis requires a computer system, with the appropriate hardware and software to process the remotely sensed data, which is recorded in digital format. |
|
Both analogue and digital approaches share several image analysis tasks and basic photorecognition elements of image interpretation: |
|
Source : Estes et. al. |
| 3.2.1 Digital Image Analysis vs. Visual Interpretation | |
a. Manual (visual) approach to image interpretation Remote sensing data can be basically seen as wavelength intensity information, which needs to be decoded before the message can be fully understood. This decoding process is analogous to the interpretation of the remotely sensed imagery, which relies on our knowledge of the properties of electromagnetic radiation. In order to extract meaningful information out of these data the image interpreter has to exercise his judgement, his scientific knowledge, his general knowledge of the phenomena as well as his experience, so that he will be able to make truthful assumptions about the object/feature under investigation. The first stage of image interpretation is known as detection. The detection stage is naturally followed by the recognition and identification stage in which the image interpreter has to exercise general, local, as well as specific levels of reference to allocate objects into known categories. The general level is the interpreter’s knowledge of the phenomena and processes to be interpreted, the local level is the interpreter’s intimacy with his own local environment, and the specific level is the interpreter’s deeper understanding of the processes and phenomena that he wants to interpret. In recognition and identification, the non-geometric image characteristics of tone or colour, texture, pattern, shape, shadow, size and location normally give clues. The result of identification is a list of objects and features in the area. These form the basis of delineation of areas having homogeneous patterns and characteristics. This is the analysis stage. Each delineated area has to be classified through a process of induction (general inference from particular cases) and deduction (particular inference from general observations). Accuracy is then controlled by field checks. The final stage of the interpretation is classification, producing spatial data which can be displayed as maps, or incorporated into a Geographic Information System. |
|
b. Computer-assisted approach The manual approach suffers from its inability to deal quickly with a large quantity of image data. The development of computers led to the invention of “digital” methods of image interpretation. Image interpretation is basically a classificatory process identification and recognition can be treated in mathematical terms, provided that image data in digital form are available. However, the computer cannot replace the knowledge, experience, intelligence or understanding of the human – image interpreter. Various techniques such as Artificial Intelligence and Image Understanding, developed by scientists in order to improve the results of computer assisted image interpretation are being studied. The computer – assisted approach is usually based on: |
|
| Therefore,
visual interpretation of digital imagery provided by remote sensing platforms does not
allow full exploitation of the data provided. A human can only visually interpret 3 layers
of remotely sensed information at a time. Further, our visual acuity does not allow us to
identify all spectral differences in imagery. Machine processing of imagery allows for the quantitative analysis of all spectral bands in imagery simultaneously, and is able to detect subtle differences that we cannot.
|
|
| 3.2.2 Advantages and disadvantages of analogue and digital methods: | |
a. Analogue methods: a1. Characteristics and advantages Traditional: intuitive. Simple, inexpensive equipment. Uses brightness and spatial content of the image. Usually single channel data or three channels at most. Subjective, concrete, qualitative. |
|
a2. Disadvantages: The human interpreter understands much easier remote sensing data from the visible part of the spectrum and can observe and analyse only one image at a time. Therefore, the manual approach of image interpretation is recommended: |
|
b. Digital methods Recent: require specialised training Complex, expensive equipment. Rely chiefly upon brightness and spectral content, limited spatial. Frequent use of data from several channels. Objective, abstract, quantitative. b1. Advantages Cost-effective for large geographic areas Cost-effective for repetitive interpretations Cost-effective for standard image formats Consistent results Simultaneous interpretations of several channels Complex interpretation algorithms possible Speed may be an advantage Explore alternatives Compatible with other digital data b2. Disadvantages: Expensive for small areas Expensive for one-time interpretations Start-up costs may be high Requires elaborate, single-purpose equipment Accuracy may be difficult to evaluate Requires standard image formats Data may be expensive, or not available Preprocessing may be required May require large support staff Therefore, the computer-assisted approach is recommended: |
|
Reference: R. Douglas Ramsey Doug@nr.usu.edu, Utah University, C.P.Lo., “Applied remote sensing”, University of Georgia.
|
|
| 3.3 Pre-processing of digital Remotely Sensed Images | |
a. Radiometric Corrections |
|
b. Geometric corrections During the acquisition of digital multi-spectral remotely sensed images, some systematic and non-systematic errors influence the images' geometrical quality. For systematic errors, relevant geometric corrections could be performed depending on: |
|
| For non-systematic errors, such as: | |
is required the knowledge of the geodetic co-ordinates of some
relating points on the ground, which, simultaneously, are well–defined on the remotely
sensed images and consequently their image co-ordinates can be measured in pixels lines
and columns.
|
|
| 3.4 Simple Image Enhancement of Remotely Sensed Images | |
|
|
| a. modification of each pixel regardless of the value of the
adjacent pixels, or b. modification of each pixel, taking into account the pixels around it. |
|
| The most common techniques in image enhancement are: | |
| 1. Contrast Enhancement. 2. Pseudo-colour Enhancement - Density Slicing. 3. Image enhancement through basic calculations. 4. Edge enhancement. 5. Filtering. 6. Other transformations such as: Principal Component Analysis, Vegetation Index, Kauth-Tomas/Tasseled Cap transformation, Multiple Discrimination Analysis, Hue-Saturation-Intensity Analysis, Fourier Analysis etc. |
|
| Additionally, image reduction and magnification can enhance image resolution and provide more particular information on the whole or a part of the image, as well as a histogram of pixel values along a line on the image. | |
| 3.4.1 Contrast Enhancement | |
Remote sensing systems record reflected and emitted energy from earth surface materials. Ideally, one material would reflect a tremendous amount of energy in certain wavelengths, while another material would reflect much less energy in the same wavelengths. This would result in contrast between the two types of materials when recorded by a remote sensing system. Unfortunately, different materials often reflect similar amounts of radiant flux throughout the visible and near-infrared portion of the electromagnetic spectrum, resulting in a relatively low contrast image. In an image like this, all characteristics of earth (related to the natural and the socioeconomic reality and their changes through time etc.), become similar to the environment around them and not discernible. |
|
| 3.4.2 Pseudo-colour Enhancement - Density Slicing | |
Pseudo-colour enhancements of an image intend to convert it from greyscale to colour (not necessarely to natural colours or like false infrared), in order to use all values of the electromagnetic spectrum. The discrimination ability of the human eye is usually limited to 16 different grey levels. This limitation may be overcome if greyscale images are converted to pseudo-colour. This conversion allows the utilisation of the entire range of the image brightness values or portions of it in different hue values. Density Slicing is the technique that assigns different hue values to each greylevel, in order to make the discrimination of different homogenous zones easier. Usually, the selection of the successive portions is arbitrary and this causes loss of information. Studying the histogram and selecting the portion that refers to discernible homogenous zones could prevent this. In this case the final image after density slicing control will be enhanced and much easier to interpret. |
|
| 3.4.3 Image enhancement through basic numerical calculations | |
A remotely sensed image of the earth is a 3-D numerical matrix. |
|
The pixel’s digital value range is determined by the radiometric
resolution of the sensor:
|
|
| 3.4.4 Edge enhancement | |
Image interpretation of a remotely sensed image may be easier if the edges of the objects/characteristics are enhanced by an edge enhancement operation, so that their shapes and details are enhanced. Generally, what eyes see as pictorial edges are simply sharp defferences in brightness value between two pixels. The edge enhancement of a remotely sensed image can be performed, either with linear edge enhancement or with non-linear edge enhancement. |
|
| 3.4.5 Filtering | |
The filtering of a remotely sensed image aims at the enhancement/improvement of the image, either with the elimination or compression of certain spatial frequencies and linear characteristics which abstract to the interpretation of other interesting characteristics (road network etc.) or with the enhancement of spatial frequencies and linear characteristics which concern us the most (boundaries of water resources). The procedure, which is used to decompose a remotely sensed imagery to its different spatial frequency components, is Fourier Analysis. Applying Fourier Transform on the original remotely sensed image is a way to enhance certain interesting spatial frequency components for image interpretation, contrary to others that do not interest us. The algorithms, used for such an enhancement/improvement, are filters such as: |
|
High pass filters emphasize high frequency spatial characteristics,
thus enhancing the linear characteristics of a remotely sensed image.
|
|
| 3.4.6 Special enhancement transformations | |
Some of the special enhancement transformations used for natural resource inventories and monitoring, are related to principles, methods and techniques already mentioned. So, we can use transformations, such as: |
|
|
|
| 3.5 Classification | |
Remote sensing data are records of reflected and emitted electromagnetic energy presented as picture like images. In order to extract meaningful information out of the data, an interpretation of the image has to be carried out. The image interpretation is made with the help of an electronic computer, where use of mathematical algorithms takes place, provided of course, that the data are in digital form. The classification methods of the computer-assisted approach are: |
|
| Unsupervised
classification is not generally as effective as supervised classification because of the
absence of training sets to control the results, especially when classes are only
marginally separable. However, supervised classification is still too slow to handle a
massive influx of satellite multi-spectral data. The results of the classification from
the computer-assisted approach can be presented as a thematic map, which can be stored in
digital form. The computer can also display numerical information on the area of the
mapped classes or the frequency of the occurrence of each class and other useful
statistical data if required. Reference: C.P.Lo., “Applied remote sensing”, University of Georgia. Jensen, J. “Introductory digital image processing”, University of South Carolina, 1986.
|
|
 |
National Technical University of Athens |