 |
|
![]()
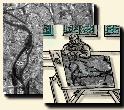
The resulting image (Figure 65) is a noisy image composed of built up and non built up pixels, which cannot be used as a mask of the urban area.
 |
To obtain better defined regions (urban/non urban zones), the result of this fuzzy classification is combined with segmentation by edge detection of the second band. In the segmentation process, the extracted regions must be big enough to be relevant but also, small enough to be homogeneous. So the image segmentation process needs several steps. Our automatic method is based on the ``split and merge'' algorithm.
First of all, the clusters with high contrast edge (high gradient values) are considered. These clusters have the best probability of matching with the real ones. Then, the homogeneity of each cluster is analyzed using the previous classification result. The coefficient of homogeneity of a cluster is the variance of the membership coefficient to the built up class into the cluster. So a cluster is homogeneous only if the membership coefficients are closed to each other.
The improper clusters are split considering lower contrast edges (lower gradient values). The process is performed again, until the homogeneity of every cluster is sufficient.
In every parting step, new edges pixels are added, that must belong to one of the two classes: urban/non-urban. To classify an edge, the classes of the clusters that it delimits must be taken into account. First, the distance between this edge and these clusters is computed. Then, the edge is merged with the `` nearest '' cluster . The distance between an edge and a cluster is defined as the absolute value of the difference between the membership coefficient of the edge to the built up class and the average membership coefficient of the pixels of the cluster to the built up class.
Finally, a set of labeled clusters is obtained. Some clusters are too small to be relevant to define the urban area. So the small resulting regions (user defined minimal surface) are grouped with one of their neighbours, according to their classification result. The distance between two regions is defined as the absolute value of the difference between the average membership coefficient of the pixels of the two clusters to the built up class.
To create the segmentation, the same algorithm as the previously described one (SDEF) is used. The opened chains are closed only if their length is sufficient and if the gradient values of the added pixels are high enough in comparison with the gradient value of the chain extremity. If not, this chain will be able to define a cluster in the next step of the algorithm (consideration of less contrasted edges).
The result of this first step is a set of regions, labeled with their average membership coefficient to the urban class (Figure 62).
They define the fuzzy urban mask. The more the cluster is white, the more it corresponds to a piece of an urban area. The urban mask used in the second step is made of the regions which membership coefficient to the urban class is greater than 50 (Figure 66).
 |